Fan

How your club and its rival play, described in numbers.

Not a commentary — a record action by action, and what follows from it.

Sound familiar

  • After a game everyone has an opinion and nobody has data.
  • You want to know what the opponent really stands on before you play them.

A team report in a matter of seconds

Wins compared with losses, the rhythm of the quarters, shot zones, scoring runs.

Context from real competitions

Over four thousand imported games make it possible to place one team's numbers against the level of the competition instead of judging them in a vacuum.

From the table to the training session — four steps, one chain of data

Nothing has to be retyped between tools. What you write down at the table travels all the way to the training recommendation.
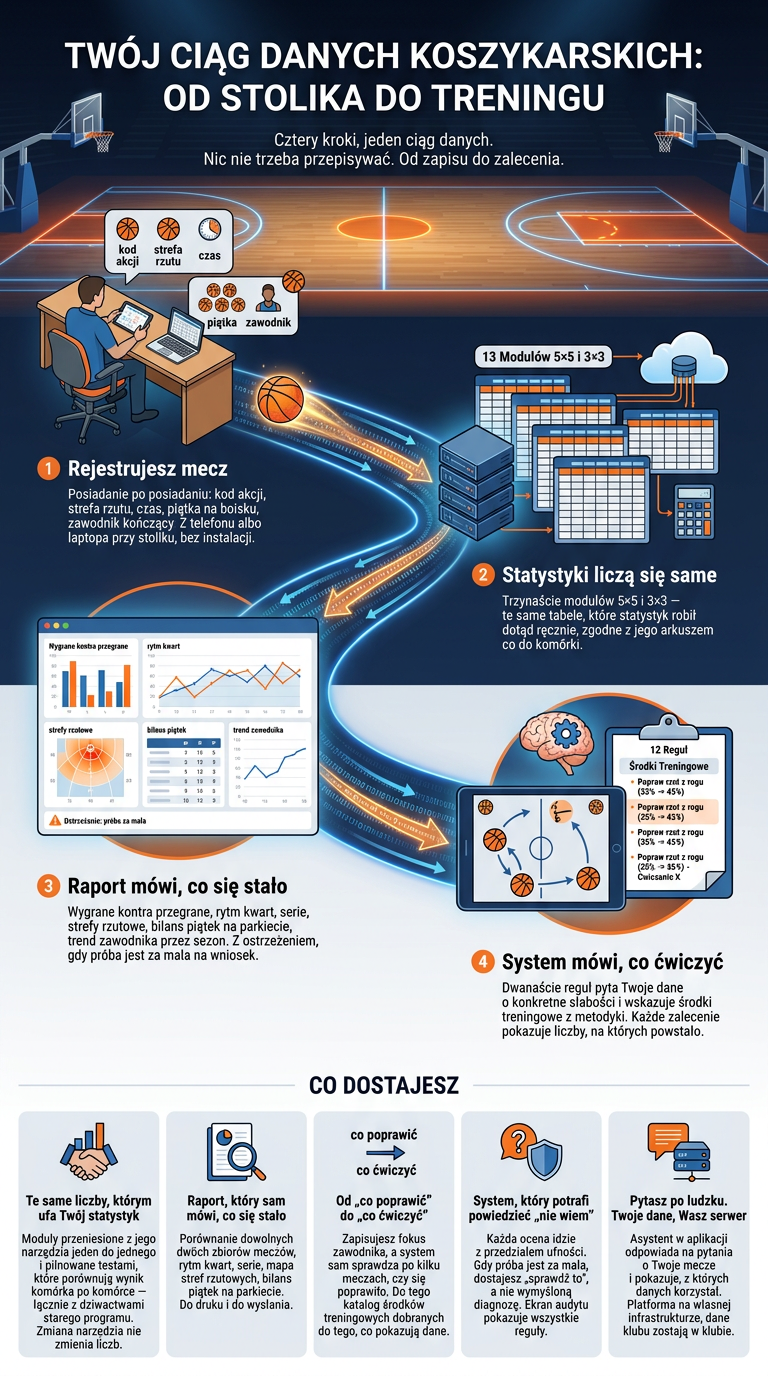
Four steps: you record the game at the table, the stats compute themselves, the report says what happened, and the system points at what to practise.
  1. You record the gamePossession by possession: action code, shot zone, time, the five on court, the player finishing it — from a phone or a laptop at the table.
  2. The stats compute themselvesThirteen 5×5 and 3×3 modules — the same tables your statistician has been building by hand.
  3. The report says what happenedThe rhythm of the quarters, runs, shot zones, the balance of each five, a player's trend — with a warning when the sample is too small for a conclusion.
  4. The system says what to practiseTwelve rules ask your data about specific weaknesses and point at drills from the coaching literature.

Access to a club's data is granted by the club. There are no public team profiles today.