The game recorded at the table, the conclusions the same evening
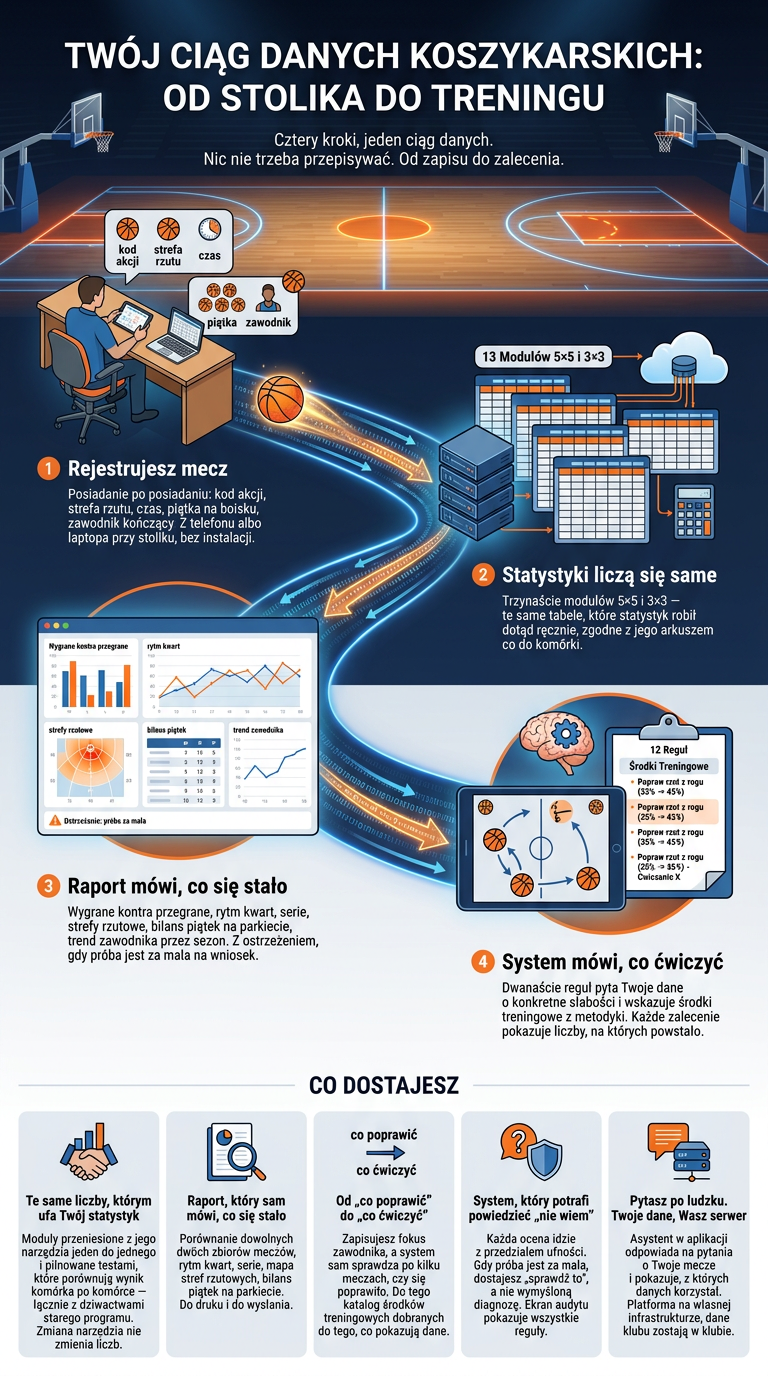
You record possession by possession — action code, zone, time, the five on court. Right after the game you have the full set of tables and a summary: the rhythm of the game, where the points came from, tempo, runs, turnovers, a map of shot zones and the on-court balance of each five.
The comparison that ends the argument
You pick two sets of games — wins against losses, home against away, the last five against the rest of the season — and you get the difference written out as a number. You choose the set with filters, and the report names the games it computed from.
A player's trend across the season
Five measures for one player, game by game: points, three-point percentage, share of possessions, on-court balance and the third quarter separately. You mark the game where you changed something, and the chart shows “before” and “after”.
The training loop: you write down what to improve — the system checks whether it improved
You record a focus on a specific metric for a player. After a few games you get a verdict: improvement, no change, or not enough data. You do not have to remember it or work it out by hand.
Specific drills, not generalities
Twelve rules ask your data questions such as “are the free throws weak enough that they need work”. When one of them fires, you get a circuit of drills from the coaching literature — with performance criteria and the source they came from.
A system that says “check this” instead of guessing
Every verdict comes with a confidence interval. If the number itself is on the wrong side of the threshold but at that number of attempts it could be chance, the system asks for an assessment instead of recommending drills. The “Why this one?” screen shows every rule — including the silent ones, and says why.